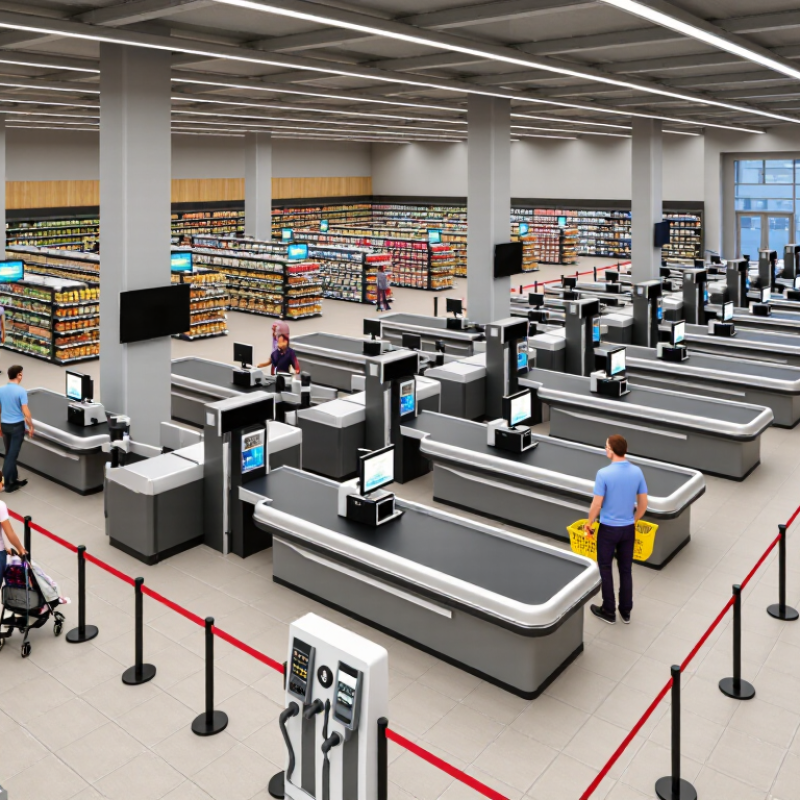
An efficient checkout area is more than a row of tills. It is the final part of the shopping journey, where queue design, staff movement, and clear sightlines shape a customer’s last impression. Retail anthropologist Paco Underhill has said, “The checkout is the last place where a retailer can make a good impression on a customer.” That idea gives this guide its starting point.
To understand how to design an efficient supermarket checkout area layout, begin by watching how people actually move through the space. Notice where baskets collect, where queues spill into aisles, and whether customers can see an available register. Leave clear routes for shoppers using wheelchairs or pushing strollers, and keep staff pathways free of boxes and stray hand baskets. Even a small obstruction can turn a smooth queue into a frustrating stop.
The right plan depends on store size, peak-hour traffic, product mix, and the balance between staffed and self-service tills. Positioning impulse items may support sales, but displays should not narrow the queue or block access to essentials. Check sightlines from the entrance and nearby aisles; a customer should be able to spot where to join without asking. Local accessibility and fire-safety requirements also matter, so verify the plan against applicable standards before installation.
Small details matter. A little awkwardness may remain, especially during rush periods. That is worth reviewing rather than ignoring. This 2026 guide explores practical ways to assess traffic, compare checkout formats, arrange queue lanes, and refine the layout using real customer and staff observations.
Forecast Peak-Hour Demand from POS Data Using Little’s Law (L = λW)
Peak-hour checkout design should start with arrivals, not floor area. Export POS transactions in five- or ten-minute intervals, then count shoppers rather than sales dollars. The USDA Economic Research Service reported that food-at-home prices rose 1.2% in 2024; higher prices can lift transaction values without increasing queue arrivals.
Small errors matter. For each peak interval, calculate λ as arriving shoppers per minute and apply Little’s Law:
L = λW.
If 18 shoppers arrive every ten minutes, λ = 1.8 per minute. A four-minute average wait implies about 7.2 shoppers waiting, on average.
That estimate does not tell you how many lanes to open. Measure service time from POS timestamps, then compare arrival rates with each lane’s observed capacity. If a cashier completes 24 shoppers per hour, six open lanes can handle 144 shoppers hourly before interruptions; at 108 arrivals, utilization is 75%. Keep a lane in reserve for price checks, bulky baskets, or shift changes.
FMI’s U.S. Grocery Shopper Trends reports are useful context for shopper expectations, but local POS data should drive the actual staffing plan. One awkward caveat: promotions and school pickup times can shift the peak from week to week, so a single “busy hour” average may mislead.
Plan Accessible Checkout Routes to the ADA’s 36-Inch Minimum
A smooth supermarket checkout begins with a route shoppers can actually use. Keep at least 36 inches of clear width along accessible paths, measured between the nearest fixed obstacles. A display corner, queue post, or bag rack can quietly steal that space. Small details matter.
Map the route from the main aisle to an accessible checkout, then check it with a tape measure after fixtures are installed. The ADA Standards allow a limited 32-inch reduction in certain short sections, but that exception is not a reason to design narrow aisles. Checkout aisles also have specific accessibility requirements, so verify the layout against the current standards and local review process. Keep carts, baskets, and promotional stands outside the clear path, especially where shoppers turn or join a queue.
Give the accessible lane enough room for a wheelchair to approach the counter without awkward reversing. Test the turn. A plan can look generous on paper and feel cramped beside a waiting cart. Review the layout during busy periods, when lines shift and displays tend to migrate. Some stores discover this too late; moving a fixture afterward is possible, but not ideal.
Set Lane Mix Using Measured Service Times for Staffed and Self-Checkout
A checkout layout should start with measured service times, not a preferred number of lanes. Measure real visits. Record staffed transactions from the first scan through payment, and note interruptions such as price checks or age verification. Track self-checkout separately, including assistance and payment delays. A twelve-item basket may move quickly until an unexpected produce lookup slows the queue.
Collect observations across quiet periods, lunch peaks, and weekend rushes. Use medians and ranges, not one unusually fast shift, to estimate how much work each lane type can handle. Then compare expected customer arrivals with that capacity. A simple spreadsheet can reveal whether staffed lanes are overloaded while several self-checkout stations sit idle. Keep the time window consistent.
Set the lane mix to match the store’s actual basket patterns and staffing plan. For example, frequent large baskets or customers needing payment assistance may call for more staffed capacity. Small, predictable purchases may suit self-checkout. Our first estimate may look too tidy. Recheck it after layout changes, seasonal shifts, or new checkout procedures. Watch queue length, abandoned baskets, and staff walking distance; service time alone cannot explain every bottleneck. A sensible mix is adjusted from observed results, not treated as permanent.
Model Queue Capacity with M/M/c Queuing and Peak-Period Arrival Rates
An efficient checkout layout starts with the rush, not the quiet hour. Track customer arrivals in 15-minute intervals, especially after work and before weekends. Convert each interval into an hourly arrival rate, λ. Estimate service rate, μ, from observed checkout times, rather than ideal targets. Small timing errors matter.
An M/M/c model treats arrivals as random, service times as variable, and c checkout lanes as equivalent servers. A shared queue can feed the next available cashier. Calculate utilization as λ divided by cμ; it must stay below one for the queue to remain stable. Erlang C estimates the chance customers wait and their expected queue delay. Try several lane counts against peak-period rates. If 42 customers arrive per hour and each cashier serves 15, three lanes operate near 93% utilization, leaving little room for a slow basket. That is a warning, not a perfect forecast.
The model’s assumptions are tidy. Real supermarkets are not. Customers may choose different lines, service times vary by basket size, and a payment issue can briefly stop a lane. I would not treat the result as a promise. Use it to compare layouts, then observe actual queues. Keep the line visible from the entrance, leave clear space for carts, and avoid blocking nearby aisles. A slightly imperfect model, checked against real peak-period observations, is more useful than a precise-looking number built on quiet-day data.
How to Design an Efficient Supermarket Checkout Layout 2026 - Model Queue Capacity with M/M/c Queuing and Peak-Period Arrival Rates
Illustrative peak-period planning scenarios using an M/M/c queue model. Arrival rates are expressed per hour; staffing is the number of simultaneously open checkout positions.
Model assumptions: Illustrative data, not company-specific measurements. The model assumes Poisson customer arrivals, exponentially distributed service times, an average service rate of 30 customers per cashier per hour, independent checkout positions, and one pooled queue serving the next available cashier. Utilization is arrival rate divided by total service capacity; average queue length is calculated as arrival rate multiplied by average queue wait. Actual results may differ with separate lane queues, basket size, payment method, staffing interruptions, and customer behavior. Use observed peak-period arrival and service-time data to calibrate staffing decisions.
Pilot the Layout and Track Wait Time, Throughput, and Abandonment
Pilot a checkout layout in one defined zone before changing the whole store. Mark the trial lanes clearly, then observe them during comparable periods, such as weekday evenings and Saturday mornings. Record the time each shopper joins a queue and reaches the payment point. Use the same method each time. A simple tally sheet can help staff note queue length every five minutes, but avoid letting data collection distract from service.
Track three measures together: average wait time, completed transactions per lane per hour, and abandonment. Define abandonment consistently, such as a shopper leaving a queue without paying. Note context too: basket size, open lanes, and short staffing can affect results. A layout may move more shoppers while creating longer waits elsewhere. Look closely at the physical details. Does a basket stand narrow the turning space? Do queue markers block access to nearby shelves? Keep the pilot long enough to include busy and quiet periods, then compare like with like. Small samples can mislead. If the figures disagree, inspect the queue in person and revise one feature at a time. A slightly awkward trial is still useful; record what felt unclear to shoppers and staff.
How to Design an Efficient Supermarket Checkout Layout
Illustrative pilot data — average customer wait time by layout
In this example, Layout C had the shortest average wait (4.2 minutes). During a real pilot, compare wait time with throughput and checkout abandonment under similar traffic conditions before choosing a layout.
Conclusion
Designing an efficient supermarket checkout area starts with understanding when customers arrive and how long service takes. Use point-of-sale data to estimate peak-hour demand, then apply Little’s Law to relate arrival rates, time spent in the system, and the number of shoppers waiting or being served. Measure service times at staffed and self-checkout lanes to choose a lane mix that reflects actual customer flow rather than assumptions.
To determine how to design an efficient supermarket checkout area layout, also plan clear, accessible routes that meet the stated 36-inch minimum, and use peak-period arrival rates with an M/M/c queue model to estimate lane capacity and waiting lines. Test the proposed layout on a small scale before making it permanent. Track customer wait times, checkout throughput, and abandonment, then adjust lane assignments and queue space based on what the results show.

 Ciho Racks